As the dust settles on another record-breaking Black Friday/Cyber Monday (BFCM) weekend, we’ve gathered the most significant trends and insights from our client campaigns. Here’s what stood out this year.
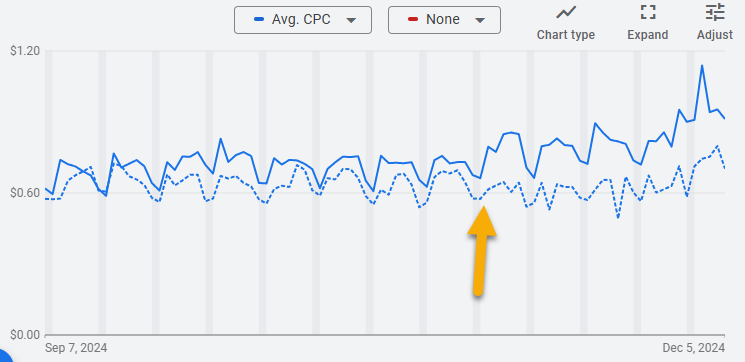
CPCs Clearly Lined Google’s Nest
For the big weekend, and for the rest of November up to that point, YoY Cost Per Click averages were just over +20% higher this year. Zooming out to the past year, and comparing to the previous year, there seemed to be an inflection point in the first week of November.

That drove total US ad spend for accounts in our reporting pool up +28%, while revenue was only up about +4%.
Conversion Rates were fairly flat to last year, which implies that the Cost of Sale (ad spend as a percent of revenue) was up, which is true. However, that’s a blended average, including both Brand traffic (navigational searches from shoppers already familiar with your brand, of which there are only so many) and Non-Brand traffic (searches for your product category or the problem you solve, which is generally more expensive per click).
In fact, StatBid’s clients saw a -14% dip in Brand ad spend, while Brand revenue was flat (+1%) for the period around BFCM (Monday before through Wednesday after). This leaves the increase in total costs to the Non-Brand campaigns, which could still hit their own efficiency targets, but drag the blended averages up, as they overwhelm the cosmetic efficiency of the relatively immovable Brand volume.
When Google removes the safeguards and tools we used to manage bids in years past, this is to be expected, as competition in the auctions becomes artificial, bordering on performative. While there may be fewer levers to pull these days, diligence on managing your campaigns burn rate is only more critical.
Traffic & Revenue Trends
Higher Black Friday Traffic: Traffic on Black Friday itself rose by 16%, while Cyber Monday saw a surprising -22% drop.

Also notable in that snapshot is the stronger performance on Saturday and Sunday, especially compared to Cyber Monday, softening the traditional “double spike” pattern.
Conversion Rates weren’t bad, gaining +11% over last year’s rate.
AOV declined slightly, losing -4% (or slightly more when adjusted for inflation).
The combination of Conversion Rate and AOV behavior led to relatively stable Value Per Click (VPC), which is the North Star when it comes to interpreting CPCs and efficiency. In fact, when describing the VPCs relative to the climbing CPCs, our data scientist described the VPC trend as “aggressively flat.”
Retail Landscape
Broader retail data offered a mix of signals:
- Online Spending Records: U.S. online sales hit $10.7–11 billion on Black Friday (up 10.2% YoY) (Adobe). Globally, $74.4 billion was spent during the 24-hour Black Friday period (Salesforce).
- In-Store Decline: Brick-and-mortar traffic fell 3.2% nationwide, with the Midwest seeing the steepest drop (7%).
- BNPL Modest Growth: Buy Now, Pay Later usage saw an 8.8% increase—less impactful than predicted (Adobe).
What Worked This Year
- Faster Promotion Approvals: Google Promo Reviews were surprisingly quick this year—often same-day, even over the holiday weekend. This flexibility enabled last-minute tweaks to client campaigns.
- Faster Asset Reviews: New Asset Groups in PMax campaigns started gaining impressions sooner after their creation than we’d come to expect, allowing for ongoing enhancements.
- Category Performance: Every apparel client experienced significant traffic gains, and shopping campaigns performed steadily year-over-year, even amid increased competition.
- Performance Max Dominated: PMax campaigns captured the lion’s share of ad spend (84%) and delivered the highest conversion value across all formats.
- Promotions Had Impact: Promotions were a standout driver of performance during BFCM. Interestingly, the type of promotion mattered more than the depth of the discount.
- Biggest Movers: Free shipping, BOGO deals, and similar offers outperformed traditional percentage-off discounts.
- Discount Trends: The average discount rate across the U.S. nudged up to 28% (from 27% last year) (Salesforce), with category peaks in electronics (30.1%), toys (26.1%), apparel (23.2%), and televisions (21.8%). (Adobe)
- Google Merchant Center (GMC): Promotions were prioritized more aggressively, with quick volume delivery.
TL;DR:
Google drove up CPCs more than previous years, while revenue was (on average) fairly flat. Promotions mattered more than previous years, especially outside of the typical deep discount type.
This year’s BFCM trends highlight the growing importance of precision in campaign management, from leveraging impactful promotions to optimizing campaign formats like Performance Max. While CPCs surged, efficient targeting ensured that the value extracted from each click didn’t waver, positioning StatBid’s clients for another strong holiday season.
If you’re ready to strategize for 2025, let’s talk. The next big season is just around the corner, and the key to success lies in staying ahead of the trends.


